
Created clean and insightful visuals to communicate data effectively. Built interactive dashboards using Power BI.
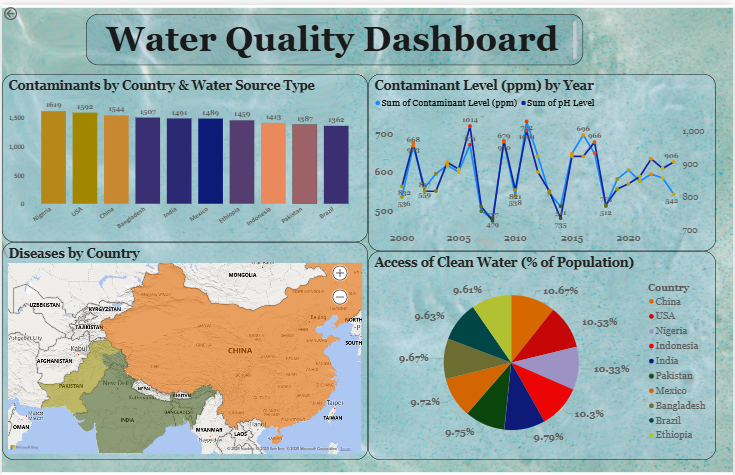
The Water Quality Dashboard highlights global water challenges by showing contaminant levels, access to clean water, and disease prevalence. It reveals country-wise contamination, yearly pollution trends, regions most affected by waterborne diseases, and disparities in clean water access, supporting informed decision-making for water management and public health.